-
Dubberly Design Office
2501 Harrison Street, No. 7
San Francisco, CA 94110 -
415 648 9799 phone
415 648 9899 fax
Blog
Anchor tags, sample post
Contents:
– Discover
– Reframe
– Envision
– Create
– Conclusion
Models are increasingly important in design—as design, in collaboration with other disciplines, increasingly deals with systems and services. Many aspects of customer experience unfold over time and location, and thus are intangible. With their ability to visualize and abstract various aspects of a given situation, models become tools for exploring relationships in ways that aren’t otherwise possible. To this end, models are able to synthesize different types of data (qualitative and quantitative), as well as inputs from various perspectives to provide visibility into issues occurring at the boundaries of disciplines. Where differences in discipline language, practices, and approaches can get in the way of problem solving, models can provide insights and frame discussions that must take place.
Models have a role to play in all phases of the design process, not just reframing and envisioning. Models frame and guide discovery and are also part of what we ultimately create and deliver. As the objectives of problem solving change with each phase of the process, so too does the role of models. The type of model we use changes to support the context and the discourse that needs to take place. Moreover, models can aid the transition from one phase of the process to another.
Over the course of several years of working with cross-disciplinary teams in innovation consultancies, I had the opportunity to create and evolve models in combination with other design research methods when solving complex problems in digital system and service design. Some situations called for new models when other tools fell short; other times, existing models were borrowed, adapted, and incorporated to work with existing design research tools. This work further evolved as part of the Design Methods Practice at Cheskin Added Value where Jan Yeager and I developed many models for working with customer and business research. They proved to be an effective means of gaining insights into open-ended problems and framing opportunities.[1]
A taxonomy of models began to emerge as a result of finding models that were repeatedly called for within the work. What follows is a description of the roles models play in each phase, along with a list of model types that are often useful in that phase. This taxonomy is partial and preliminary, but it invites discussion about what model types should be regularly used in the design process.
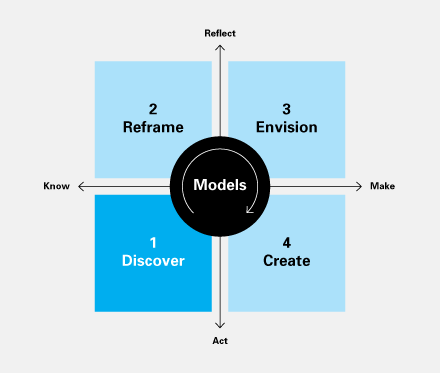
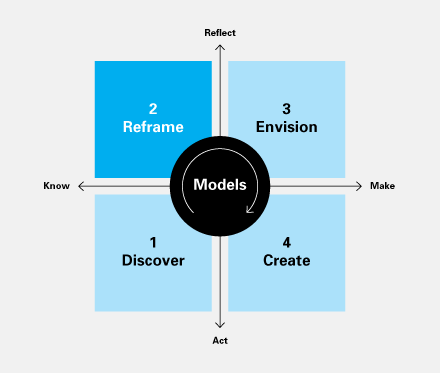
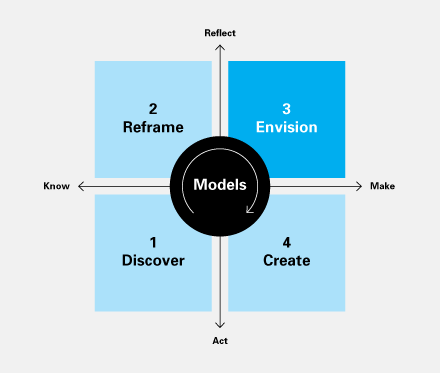
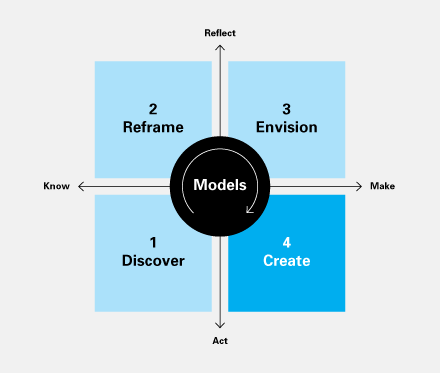
The taxonomy is organized around a four-step design process:
1: Discover
2: Reframe
3: Envision
4: Create
This model of the design process is similar to the analysis-synthesis bridge model proposed by Dubberly, Robinson, and Evenson, and as they noted, it shows up frequently in design practice.[2]
1: Discover is about understanding
the current situation
Discover models provide structural schemes for organizing and juxtaposing the often disparate sets of data gathered in research to reveal patterns and highlight key factors in the current situation. This provides clues for unlocking the problem and points to areas that require deeper analysis. In so doing, discover models provide a critical bridge for transitioning to the work that follows of reframing how we understand the current situation. Discover models include the following:
Data gathering and organizing frameworks
Frameworks are used for capturing, organizing, and mapping data to one another in ways that elicit patterns, reveal initial insights, or enable information to be extracted from the data so that it can be visually represented for further review.
A simple Excel spreadsheet can work for creating a framework that organizes data collected during research. Participants are organized along the x axis. Research topics are listed along the y axis. As research data is collected it can be populated for each participant by topic. This allows for comparisons and contrasts to be made easily and efficiently upon completion of the research.
Persona models
Persona modeling is the process of representing typical users and their goals. The term “persona” comes from the Latin term dramatis personae, the characters of the story, which was popularized by Alan Cooper as a means of clarifying the audience for a software application and helping a product team (especially engineers) understand they may not be the audience.
Personas can be defined by dimensions that characterize and distinguish customer segments from one another. Persona dimensions are selected to inform the product or service experience under exploration. To this end they may include demographic information, attitudinal information (key drivers, triggers or motivations), behavioral information (habits and practices, barriers, experiences sought, needs and desires), and information about desired outcomes or associated trends.
Audit frameworks
These are systematic inventory and analysis tools used for documenting and assessing the current situation. They’re useful for identifying patterns and comparing and contrasting attributes. Audits can be adapted to understand a broad range of things from the coherence of a brand identity system to comparing regional product design semantics or company competitive offerings.
A simple grid can be used to organize and label similar content types into groups where they can be visually compared and contrasted. Observations can be noted in the context of the framework.
Semiotic research frameworks/databases
These reveal cultural attitudes and behaviors making it possible to further decode their meaning. These frameworks/databases consist of visual imagery, video, and text gathered from readily available sources in the culture (advertisements, retail environments, material artifacts, and the Internet).
Using a database to analyze the content automates what a framework grid can simulate (though less easily). Tags are assigned to categorize content for analysis. A semiotic analysis includes sorting the categories across multiple dimensions: gender, age, status, context, ethnicity, occasions and rituals and their semantic qualities (how they look, sound, taste, smell, and feel). The resulting insights into cultural attitudes and behaviors are further analyzed to reveal their meaning in the culture.
2: Reframe requires a deep study of data
gathered to understand the current situation
in non-obvious ways
In the reframe phase, the current situation is unlocked through a richer understanding of gaps, relationships, and unmet needs. Questions raised while gathering and organizing information are more deeply analyzed in this phase, in which the current situation is considered from multiple perspectives. Models are used to cut, map, and present information in ways that reveal new salience, relationships, and meanings, which might otherwise remain hidden in data. Opportunity areas are revealed. This provides the focus for envisioning potential solutions. Reframe models include the following:
Ecosystems
Ecosystems provide a visual mapping of relationships between a constellation of players in a market. They can also be used to describe the interplay of factors impacting a customer experience. They provide “the big picture” for understanding the cause and effect behind why things exist as they are.
Market ecosystems depict a systems view of relationships, territories, interactions, and conflicts to reveal underlying forces at work in a market landscape.
Customer ecosystems visually map the interrelationships between factors that define a customer experience. They might describe the ways in which new technologies are influencing emerging behaviors or depict how lifestyle factors are impacting planning, cooking, and shopping for meals.
Trends maps
These are used in mapping recessive trends to corresponding dominant trends as a means of projecting emergent trends. Factors contributing to the trends are identified in each phase of the map. They provide a context for why a trend has occurred and whether or not it may continue in the future.
Trend maps start with a time frame that spans the past, present and future eras being investigated. Corresponding causal factors are listed under each era. This sets up a framework upon which past customer behaviors can be recalled and then followed into their present-day manifestation and projected into potential futures.
Attitudinal models
These models are a means of associating customer motivations to their behaviors and the experiences they seek and either may or may not achieve.
They are organized sequentially starting with customer motivations or action triggers. Following this is visual constellation of their interrelated behaviors. The model culminates in outcomes that may take the shape of benefits, aspirations, or meanings achieved.
Behavioral models
These are sometimes referred to as customer journey models. They provide detailed descriptions of customer behaviors in the context of a product or service experience to reveal pain points (opportunities) and identify what’s currently working.
Depending on the nature of the experience these models may or may not be sequential. While corresponding attitudes can be mapped to the behaviors, the emphasis is on deconstructing behavioral elements and their relationships to each other for further examination.
Process models
These models break down a sequence of activities into their component parts, to provide a context for understanding when things happen and why.
Process models can be used to describe systems, customer environments,or customer pathways and decision points throughout stages of a purchasing process. Insights may take the form of decision accelerants and deterrents, iterations, considerations, and rationalizations.
Comparison frameworks
These framworks can be used to evaluate aspects of a customer experience, characteristics of a brand, or attributes of a product or service.
They can take several different forms depending on the content and objective. Continuums consist of opposing attributes at each end of a spectrum. Multiple spectrums can be created to describe different aspects of an experience, etc. Matrices plot evaluation criteria on an x/y axis and are used to compare, contrast, or score key aspects of a customer experience. This can be used as a basis for making recommendations to clients about what they should stop doing, continue doing, and consider doing.
3: Envision is about
exploring potential solutions
During the envision phase, ideas are generated, evaluated, and prioritized for the opportunity areas identified. Models provide a framework in which designers can identify possibilities, explore alternatives, and envision new realities that are grounded in research insights. The resulting solutions frame and prioritize potential courses of action for addressing the situation. Paths from the current situation to the desired future state are conceptualized. This provides context for the work that follows in actualizing a solution. Envision models include the following:
Idea-generation models
These models are used in facilitating participants through an ideation session. They combine various aspects of a solution that need to be present when generating ideas or solution-oriented scenarios. They’re an integral part of the ideation process in a session.
Depending on the situation at hand these models may lay out principles that serve as guidelines for ideating on products, services, experiences, messages or positioning. Alternatively, they may include motivations, behaviors and contexts as the components from which to generate solution-oriented scenarios for customers.
Prioritization frameworks
These are used for plotting ideas, scenarios, or features so they can be evaluated, compared, and contrasted.
Information is populated in a quadrant framework that is defined by two spectrums; one on the x axis, another on the y axis. These define quadrants representing different territories upon which information can then be mapped, compared and contrasted.
Design conceptual models
Envisioned solutions are described in a high-level abstract representation of how they could take shape in terms of overall features, attributes and the experience it affords customers.
A site conceptual model, for example, would provide a conceptual overview of the types of information and tools that would available. These would be clustered into categories that describe different areas of functionality and then situated into an overall site organizational scheme.
Roadmaps
These provide a systems view of the path forward for a product, service, or experience. They are a result of a confluence of customer needs, business objectives and technological capabilities as they apply to a situation.
Components of the roadmap are organized in a phased approach. They describe the path for moving from the current situation to the desired future. Roadmaps range from the high-level conceptual to detailed plans for a migration that ranges from the near- to mid- and long-term.
Scenario prototypes and frameworks
Scenarios are used to envision a customer experience in a specific context of use. They help to imagine potential futures.
Scenario prototypes are exploratory and describe the types of information and tools available to users along a path they take through a product or service or device.
Scenario frameworks demonstrate how design principles and tactics come to life in the context of a customer experience. For example, scenarios could describe how incremental improvements could change a current experience compared to what transformative changes would look like.
Prototypes
Prototypes are working models for exploring or demonstrating how design principles can translate into tangible experiences in a context of use.
The fidelity of prototypes varies depending on the stages of design development. Many Web design and product design firms have done extensive work in this area.
4: Create is about designing the future
In this phase, concepts formulated in the previous phase are explored in more concrete forms to prototype and test assumptions against reality prior to the investment in build cycles. Create models will vary based on the types of solutions that are envisioned: products, services, or experiences. Concepts are translated into concrete specifications that can include feature lists, wireframes, site maps, task flows, and page templates, among other deliverables. User testing takes place in iterative build cycles to ensure that the envisioned customer experience is useful, usable, and delightful. Create models include the following:
Object hierarchies and template structures
These are used in working with content hierarchies. They describe relationships between levels of the hierarchy in a system as well as the content at each level.
A website taxonomy is an example of an object hierarchy for evaluating existing content that’s used in determining what restructuring needs to occur. New page and templates types can be identified from the restructured version of the taxonomy.
Navigation structures
These can describe user pathways through information or provide an overview of the relationships between content, tools, and information in a system. They may also be used to describe relationships between the front and back end of a system.
Examples of navigation structures include site maps, scenario tables, process flows, and use cases.
Nomenclature and metadata rules systems
A simple spreadsheet is used to create a framework for mapping content types with metadata tags and rules for searching and sorting information in a digital system.
Governance models
Define security access to a digital system in terms of roles and corresponding access levels to information, content areas, and website administration. May also include rules for proposing, discussing, and agreeing on content or process changes.
Governance models are simple visual models and use nodes and links to depict elements of the system and text to describe the roles and privileges associated with them.
Conclusion
Models integrate information from a wide range of practice domains and data types to reveal patterns hidden in data and identify relationships. They can integrate with a wide range of methods and tools for problem solving. As the use of models grows in design practice, questions naturally arise: What are the important models? Is there a canon of models? Which models should designers be familiar with? This article proposes a taxonomy based on my experience. I invite others to offer comments, examples, and their own version of the taxonomy.
References
1: Mendel, Joanne and Yeager, Jan. “Knowledge visualization in design practice.” Parsons Journal of Information Mapping, Summer, 2010.
2: Dubberly, Hugh, Rick Robinson and Shelley Evenson. “The Analysis-Synthesis Bridge Model.” Interactions, March 1, 2008.
About the author
Joanne Mendel, MDes is a design researcher & strategist working in the San Francisco bay area. She has diverse experience that spans innovation & strategy consultancies, global corporations and startups. She’s evolved human-centered product, service and brand experiences across a broad range of industry sectors. Joanne’s passion is for the most information intensive aspects of design practice where she enjoys framing opportunities for customers within a business context. Her background spans design research, information architecture, semiotics and graphic design.
About this column
Models help bridge the gap between observing and making—especially when systems are involved (as in designing for interaction, service, and evolution). This forum introduces new models, links them to existing models, and describes their histories and why they matter.
— Hugh Dubberly, Editor
Editor’s note
Only a few authors have assembled collections of design tools. In this article, Joanne Mendel proposes a taxonomy of models, grouped according to their use in a four-phase design process. Readers may be interested in similar projects, including:
EU Usability Net, Nigel Bevan, et al. http://www.usabilitynet.org/tools/methods.htm
IDEO Methods Cards http://www.ideo.com/work/method-cards/
IIT/ID, Vijay Kumar, ID Methods Poster http://trex.id.iit.edu/news/idiom/030907/idmethods_poster.pdf
RCA, designingwithpeople.org http://designingwithpeople.rca.ac.uk/methods
people and participation.net http://www.peopleandparticipation.net/display/Methods/browse+method
Service Design Tools, Roberta Tassi http://www.servicedesigntools.org/repository
UC Berkeley, BID, Sara Beckman and Celeste Roschuni, The Design Exchange http://thedesignexchange.org/
UK Design Council has two collections
1: Design Methods http://www.designcouncil.org.uk/about-design/how-designers-work/design-methods/
2: MethdoBank http://www.methodbank.com/cgi-bin/view/Main/Methods
— Hugh Dubberly


